
Physical titer determination of AAVs by CryoTEM
Method in development
The physical titer, or capsid concentration of a sample, underpins dosing and batch-to-batch comparison, and, alongside vector content, is a key measure of product quality . Most established methods measure it indirectly.
As an example, capsid ELISA infers particle numbers from antibody binding to capsid epitopes, which may also be present on damaged or partially disassembled capsids.
Genome-based methods such as qPCR and ddPCR count vector genomes rather than capsids, so empty particles are not counted. Bulk methods such as UV absorbance report an average signal over the whole sample.
These methods however remain indirect and lack a more direct assessment of the actual sample composition, and cannot fully discriminate genome in solution from genome actually encapsulated.
TEM allows for the visualisation of each capsid individually, intact capsids can therefore be distinguished from broken ones and other debris (capsid integrity). Aggregates can also be assessed and evaluated to be integrated into the analysis.
From Images to Titer
TEM has traditionally not been used for absolute quantitation, as particle adsorption to the grid is not fully controlled and can be influenced by surface treatment, sample matrix and preparation, which typically results in an uneven particle distribution on the support.
Our approach addresses these limitations by using a continuous support, rather than the holey supports typically used in CryoTEM imaging. Moreover, several grid areas are evaluated to reduce the area distribution bias. Finally and most importantly, the on-grid particle concentration is related to the capsid concentration of the sample through calibration against reference concentrations determined by established orthogonal methods.
TEM adds what indirect methods cannot: a view of exactly what is being counted
Our approach
Particles are counted in a defined window on each image, and each count is rescaled to particles per square micrometer (µm²). Particles cut off by the image boundary are excluded. Broken capsids can be included in or excluded from the count, and both concentrations can be reported. Detection and counting are automated in Gridsee, QuTEM's proprietary image analysis software, which reduces operator bias and keeps the analysis fully traceable. As with all our analyses, only a few microliters of sample are required for the analysis.
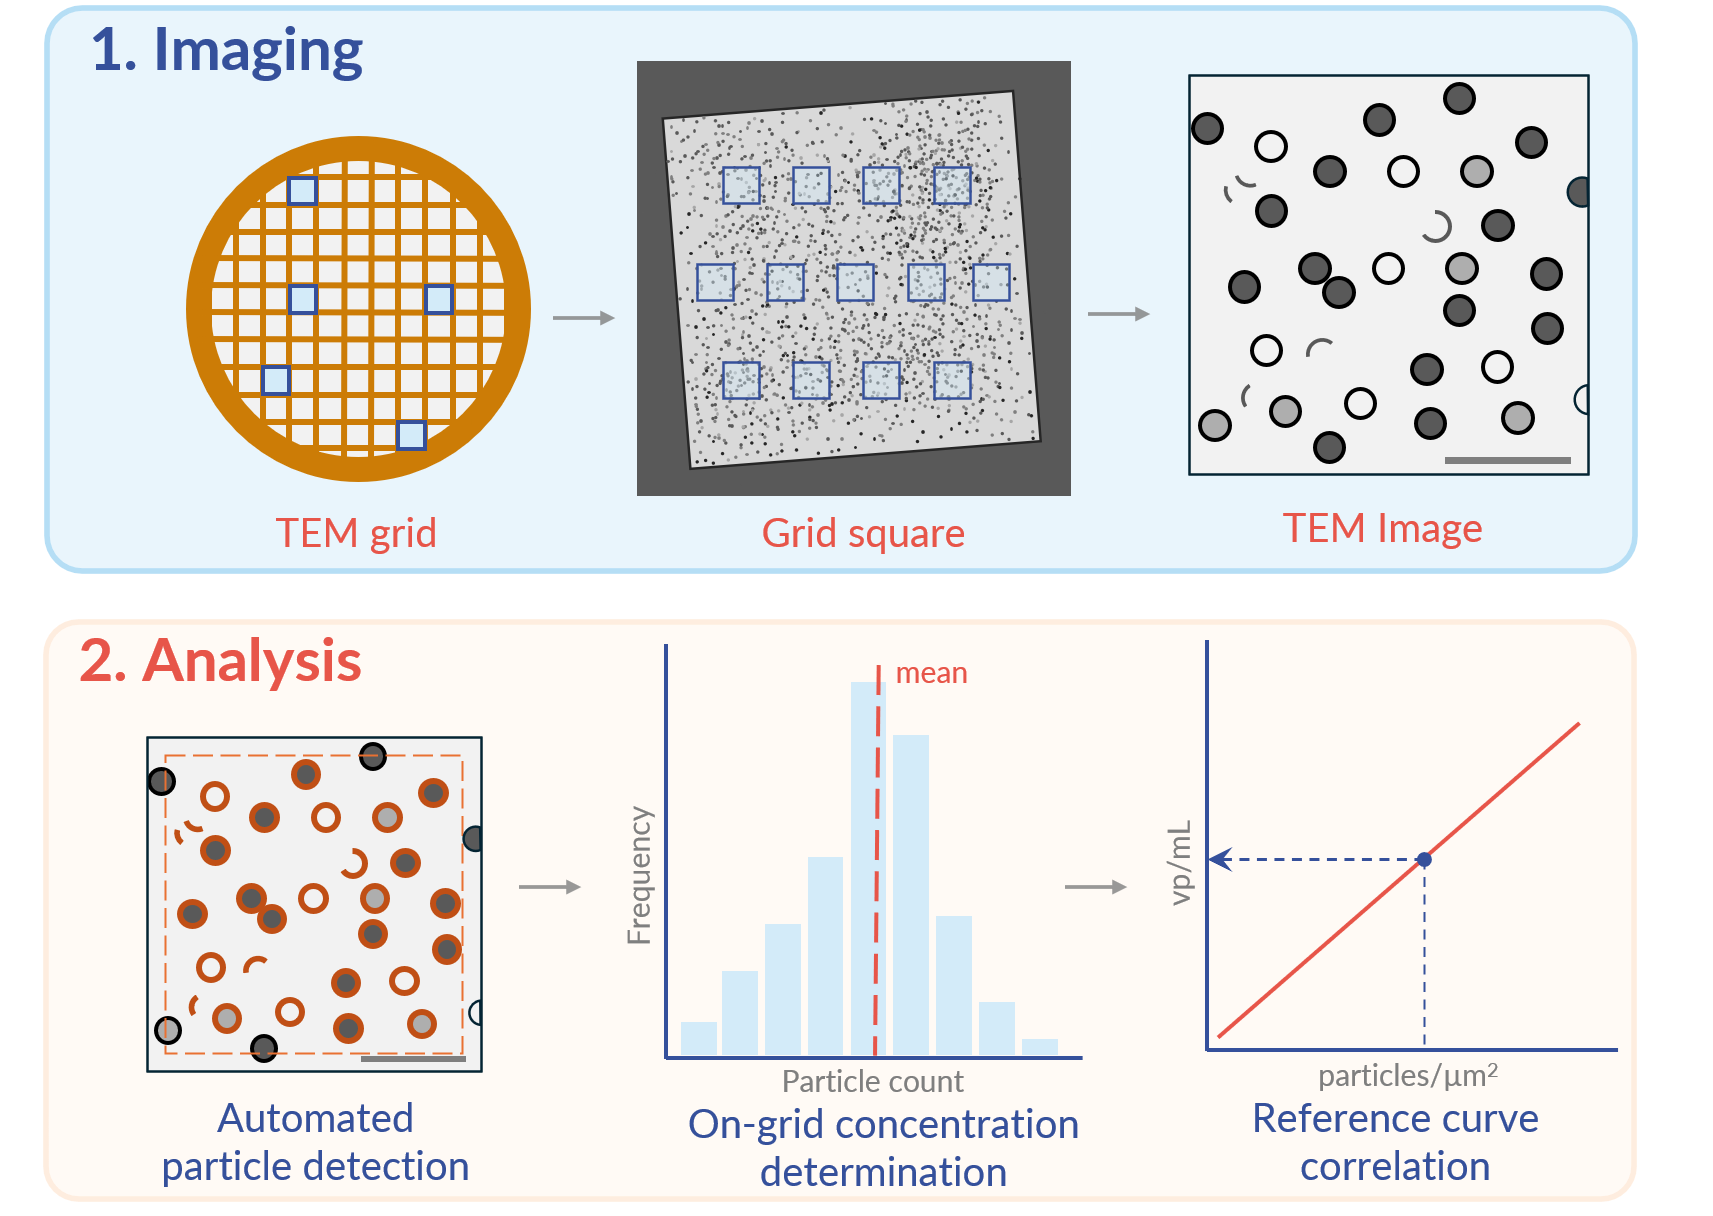
Workflow for physical titer determination by TEM.
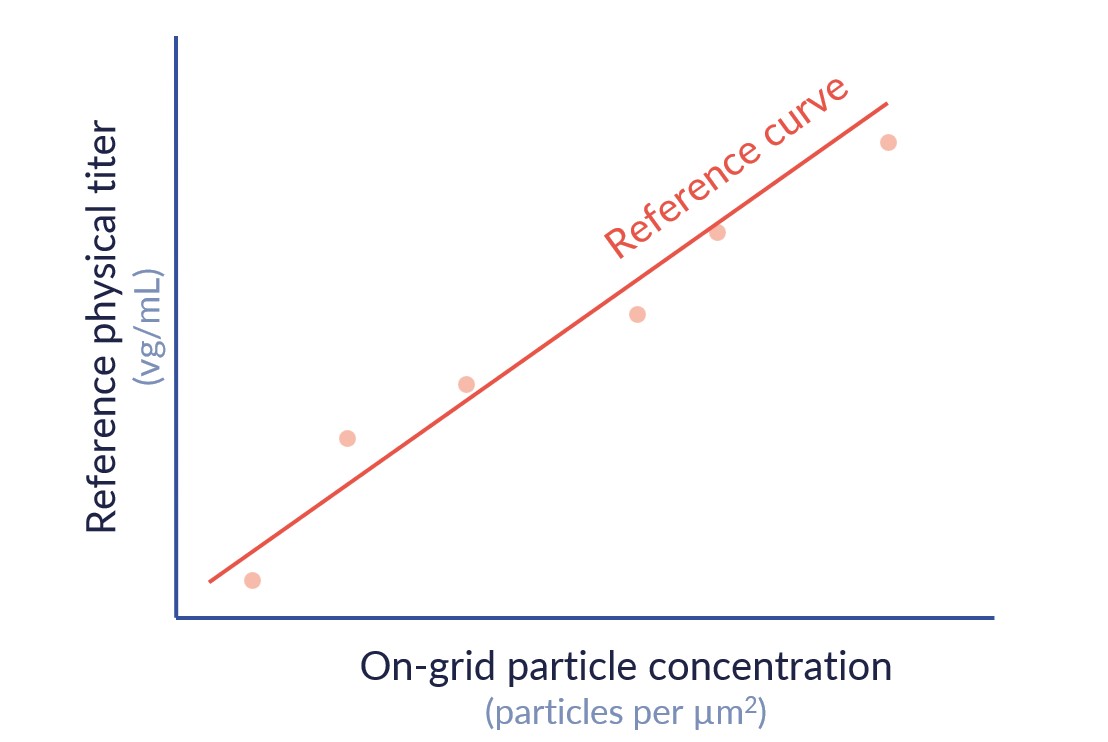
Correlation between on-grid particle concentration and reference physical titer
First results
To establish whether on-grid particle concentration reflects capsid concentration in the sample, we analysed USP standard AAV samples of known concentration and compared them with the number of particles observed per image. Two approaches were used: samples with different initial concentrations, and dilution series of individual samples. In both cases, we observed a linear correlation between particles per image and capsid concentration. The method has so far been tested on purified material from two serotypes.
At this stage, the method shows clear trends and gives a good indication of capsid concentration. Our work now focuses on acquiring more data to make the method more robust and to determine the concentration range where it performs best, so that once fully developed, its precision and accuracy are well defined.
More than a number
Since the capsid concentration comes from the same images as our other AAV analyses, it can be combined with all of them. Capsid concentration, vector content, capsid integrity and aggregation all come from one dataset. Together, they give what indirect methods cannot:
an estimate of how many intact, filled and aggregated capsids are present per mL.
Read more about our new approaches to aggregation analysis.
What's next?
We are extending the method to more serotypes and to samples from all stages of manufacturing, not only purified product, and working to improve its precision. Full method validation is our long-term goal.
Ready for analysis?
The method is still new and not yet validated, but it can already be ordered as an R&D analysis for AAVs, on its own or combined with our other AAV analyses. You receive the images, the data, the particle distribution histogram and the physical titer in viral particles per mL (vp/mL), with or without broken capsids.
Related contents

Analyses
At QuTEM, we generally offer the following analyses for AAV particles.


